|
Autor:
Luca M. Bigatello, M.D.
Department of Anesthesia and
Critical Care,
Massachusetts General Hospital,
Harvard Medical School,
Boston, Massachusetts,
USA |
|
|
|
HEMODINAMIC MONITORING IN TRAUMA
|
Introduction
Patients who sustain major
trauma may become hemodynamically unstable
at various times during their course.
Immediately following a major traumatic
injury, hypotension is common, and its
diagnosis must often be made on simple
clinical grounds, because time for
sophisticated hemodynamic monitoring is not
available. Fortunately, such diagnosis
is generally obvious: hemorrhage,
pneumothorax, and spinal shock are easily
diagnosed by the experienced clinician.
Later in the post-traumatic course,
hypotension may result from different
reasons, including hypovolemia, depression
of myocardial function, and vasodilation
from inflammation and sepsis. At this
time, the clinical exam may be insufficient
to reach a satisfactory diagnosis and
institute the appropriate therapy.
Hence, the clinician must resolve to use
further monitoring. At this point, the
trauma patient is like any other
hemodynamically unstable, critically ill
patient in the intensive care unit (ICU).
The goal of hemodynamic
monitoring is to maintain adequate tissue
perfusion. In critically ill trauma
victims, hypoperfusion of vital organs may
lead to multiple organ systems dysfunction
and death.
Classical hemodynamic
monitoring is based on the invasive
measurement of systemic and pulmonary
vascular pressures and of cardiac output.
Although burdened with possible flaws,
central pressure monitoring is widely used
in the operating room and in the ICU.
Newer monitoring techniques are promising
but, for various reasons, have not yet
reached widespread acceptance, and they will
not be described in this lecture. The
aim of this lecture is to guide clinicians
through the interpretation of hemodynamic
data based on the application of classic
circulatory physiology.
Why measure arterial blood
pressure.
Regrettably, tissue perfusion
(i.e., organ blood flow) cannot be
directly measured in clinical practice:
Organ Blood Flow = (arterial
pressure - venous pressure) / resistance
Assuming constant venous
pressure and constant resistance,
measurement of arterial blood pressure is
the closest parameter we have to blood flow.
One can easily see how crude this
measurement is: by measuring the blood
pressure at the radial artery, we hope to
estimate the adequacy of blood flow to the
kidneys, brain, and coronary circulation.
However, physiology helps our limited
capacity: under normal circumstances, organ
blood flow is maintained within normal range
through ample changes of blood pressure
through
autoregulation. Unfortunately, in
pathological conditions such as trauma and
sepsis, autoregulation is significantly
impaired, and blood flow may become directly
dependent on perfusion pressure, which
therefore must be known.
Despite the limitations of
peripheral blood pressure measurement,
maintaining a reasonable value of arterial
pressure is associated with signs of
adequate organ function in most critically
ill patients. The following
suggestions may enhance the effectiveness of
arterial blood pressure monitoring.
a.
The mean arterial pressure (MAP) is
the best physiological estimate of perfusion
pressure and is less subject to measurement
variability than the systolic pressure.
b.
A MAP > 60 mm Hg is a
reasonable target for most patients.
At times (chronic hypertension, cerebral
edema, spinal cord ischemia, etc.),
higher values are necessary.
Controversy exists on the accuracy of
clinical parameters of vital organ
function, such as urine output and
acid-base status, as early indicators of
tissue hypoperfusion. However, no
other proposed parameter, such as serum
lactate and gastric mucosal pH, has yet been
shown consistently to be superior.
c.
Optimal blood flow through vital organs is
first achieved by maintaining an adequate
circulating volume. An increase in
blood pressure achieved using
vasoconstrictor agents in hypovolemic
patients does not provide adequate organ
perfusion and can be deleterious.
How to measure arterial blood
pressure.
Non invasive
(generally automated)
oscillometric blood pressure measurement is
no longer accurate in the presence of
rapidly changing blood pressure,
arrhythmias, hypotension and hypertension.
It should not be used in hemodynamically
unstable patients.
Intra-arterial
blood pressure measurement via a
catheter-transducer system is extremely
reliable if the system is properly set up,
and should be used whenever possible in
hemodynamically unstable patients.
Physiological approach to
hypotension.
We will limit our discussion
of hemodynamics to the interpretation of
hypotension, but the general principles
illustrated here apply to hemodynamic
monitoring in general. We suggest a
simple approach to the diagnosis of
hypotension, summarized in Table 1.
This schema can be applied to
clinical practice using increasing levels of
monitoring. Table 2 shows a suggested
stepwise approach to the hemodynamic
monitoring of a hypotensive trauma patient.
In many cases, the diagnosis
can be suggested on clinical grounds.
For example, hypotension in a young patient
bleeding from a lower extremity crash injury
should be easily attributed to hypovolemia,
without the need of invasive monitoring.
In less obvious cases, it is
reasonable to ?try? an intervention, and
confirm or reject the diagnosis post-hoc
(?trial and error?). For
example, if our above patient had also a
history of coronary artery disease, one
should think of myocardial dysfunction as a
contributor to the hypotension. Volume
resuscitation could still be a reasonable
initial step.
As patients develop complex
problems during a prolonged ICU course,
the etiology of hypotension becomes be more
and more difficult to sort out, thus
requiring invasive monitoring.
Table 2.
Example of a stepwise approach to the
hemodynamic monitoring of hypotensive trauma
patients
|
Patient with sustained
hypotension/shock |
Monitoring |
Treatment |
|
Young, previously healthy patient
with lower extremity injury |
Arterial line |
Volume |
|
65 y.o. patient with lower extremity
injury and a history of heart
disease |
Arterial line |
?Trial & erroRÃo: volume, in a
limited amount |
|
Same patient, who did not respond to
a limited volume challenge |
Arterial line + central monitoring |
According to central monitoring |
|
Same patient, hypotensive a week
later in the ICU |
Arterial line + central monitoring |
According to central monitoring |
Central venous pressure (CVP)
monitoring provides a useful estimate of the
volume status of the systemic circulation
and (see below the discussion of
interpretation of CVP). The main
limitations of CVP monitoring are that
a) it does not allow measurement of
cardiac output, and b) it does
not provide reliable information on the
status of the pulmonary circulation in the
presence of left ventricular dysfunction.
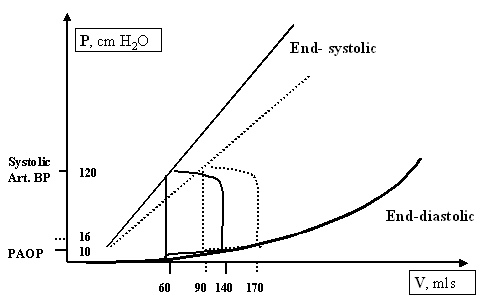
Pulmonary artery (PA)
pressure monitoring
with a PA catheter allows to measure (CO)
and stroke volume (SV), PA pressure and PA
occlusion pressure (PAOP) and hence to
separately assess the performance of the
right and the left ventricle (RV and LV).
Central pressure measurements
are often used to estimate volumes,
i.e., the CVP estimates the volume of
the systemic circulation and the PAOP
estimates the volume of the pulmonary
circulation. As long as the postulate
that central pressures accurately reflect
volumes holds true, the characteristic
hemodynamic findings of hypotensive patients
are straightforward, as summarized in Table
3.
Table 3.
Central pressures and cardiac output changes
in hypotension
Hypotension
|
CVP/PAOP |
CO/SV |
|
|
?/span> |
?/span> |
|
Obstruction |
?/span> |
?/span> |
|
Myocardial dysfunction |
?/span> |
?/span> |
|
Arterial vasodilation |
?/span> |
?/span> |
The following decision
tree may guide in the interpretation of
hemodynamic data obtained with invasive
monitoring in a hypotensive trauma patient.
1.
Make a working diagnosis
based on the relationship between pressures
(CVP and PAOP) and cardiac output (CO or SV)
as summarized in Table 3. We assume at
this point that the CVP and the PAOP are
adequate estimates of the RV and LV
end-diastolic volumes respectively and that
the right (CVP) and left (PAOP) side of the
circulation are equally affected by the
cause of hypotension.
2.
Revise our basic assumption
that CVP ? volume of the right side of the
circulation and that PAOP ? volume of the
left side of the circulation.
Unfortunately, this assumption is often
flawed. Knowledge of the basic
physiology underlying the pressure/volume
relationship in the central circulation is
required to accurately interpret central
vascular pressure data. Our basic
assumption can be altered under three main
circumstances:
a.
When the volume/pressure relationship (compliance)
of the RV or LV is abnormal, as it may
happen with concentric LV hypertrophy (LVH)
from hypertensive cardiomyopathy and aortic
stenosis. In this case, the measured
PAOP overestimates the LV end-diastolic
volume.
b.
When the pressure measurement
does not estimate the actual transmural
pressure
across a cardiac chamber. An increase
of intrathoracic pressure gets transmitted
to the blood vessel where the tip of our
catheter is lodged, and increases the
measured vascular pressure without any
actual increase in circulating volume.
Common causes of increased intrathoracic
pressure that mislead the interpretation of
CVP and PAOP include PEEP, autoPEEP and
increased intra-abdominal pressure.
The fraction of pressure transmitted through
the blood vessel depends on a number of
factors, including the compliance of the
anatomical structures involved and the
tension of the blood vessel wall. A
reasonable idea of the amount of pressure
transmitted can be derived by considering
the values of compliance of the lung and of
the chest wall. For example,
transmission of auto-PEEP in a patient with
COPD (compliant lungs) may be substantial,
while transmission of applied PEEP in a
patient with ARDS (stiff lungs) may be
minimal.
c. Mitral
stenosis.
Valvular heart disease may affect the
interpretation of hemodynamic monitoring in
many ways, and yet invasive monitoring may
be crucial in the interpretation of
hypotension in patients with valvular
defects. With significant mitral
stenosis, the PAOP may not correctly
estimate the LV end diastolic pressure
because of inadequate LV filling time.
Hence, a high PAOP may be recorded when the
LV is still underfilled.
d. Ventricular
interaction.
RV volume overload from pulmonary
hypertension and/or RV congestive failure
may dilate the RV to a degree sufficient to
move the interventricular septum towards the
LV and limit its filling. Thus, the LV
pressure- and hence the PAOP- will increase
despite a lower volume of blood in the LV.
It is important to note that
in all the above situations, the pressures
measured are indeed correct, rather
than measurement errors. A high PAOP
in the presence of severe concentric LVH or
mitral stenosis is an accurate reflection of
the high pressure in the left atrium and, as
such, can result in acute pulmonary edema.
However, the LV may still be underfilled.
This example underscores both the difficulty
and the possible benefit of the correct
interpretation of invasive hemodynamic
monitoring in complex circumstances such as
valvular heart disease.
3.
Look at the
history.
The hemodynamic values evaluated at each
discrete point in time have to be put in the
patient?s context. Although any
properly obtained hemodynamic profile should
be interpreted as the reflection of a
specific moment in time, looking at previous
numbers as well as at all other relevant
clinical variables improves the accuracy of
our measurements.
4. Separating RV
and LV.
The CVP and PAOP may change independently,
because they measure two separate entities.
The CVP measures a pressure in the systemic
circulation, and the PAOP in the pulmonary
circulation. To better understand this
point, let?s examine the effect of a
hypothetical episode of acute, isolated LV
dysfunction from, e.g., ischemia.
The decreased LV contractility causes a
decreased stroke volume (SV), and a few less
mls of blood enter the systemic circulation.
This decrease of SV is so minimal in respect
to the size of the venous reservoir that has
no discernible effect on the venous return
to the RV. Thus, the RV continues to
eject an approximately normal SV, which will
be ?accommodated? by the dysfunctional LV by
increasing the LV end-diastolic pressure
(~PAOP). At steady state, the SV of
the two ventricles will be again equal and
close to normal. Figure 1 summarizes
graphically these events:
|
|
CVP |
PAOP |
SV |
|
Isolated LV failure |
?/span> |
?/span> |
?/span> |
|
LV failure + compensated RV failure |
?/span> |
?/span> |
?/span> |
|
Biventricular failure |
?/span> |
?/span> |
?/span> |
|
Isolated RV failure |
?/span> |
?/span> |
?/span> |
|
RV failure + volume infusion |
?/span> |
?/span> |
?/span> |
Interpretation of the CVP.
The following discussion is designed to
assist in the interpretation of the CVP when
the measurement of the CO is not available.
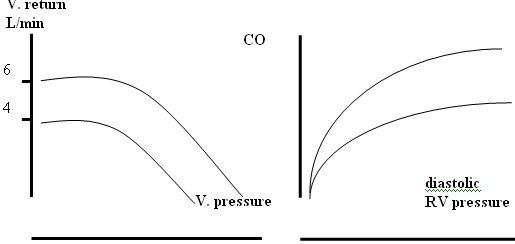
Venous return and CO are
described by these two curves:
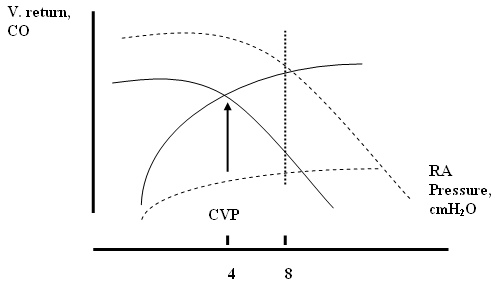
In this graph., the starting
CVP is 4 cmH2O. If the CVP
increases to 8 cmH2O, the new
value can occur at a variety of CO values,
as shown by the dotted vertical line, with
different physiological implications.
The two possible extremes are that the CVP
has increased only due to an increase in
volume (new venous return curve) or that it
has increased only due to a decrease in
contractility (new Starling curve).
Clearly, a combination of both phenomena is
possible. The same thinking process
can be illustrated for a decrease in CVP.
Hence, an isolated CVP value can represent
very different hemodynamic conditions, and
without a CO measurement, we have to use
clinical equivalents to interpret the change
in CVP. In a reasonably stable
patient, changes in MAP should parallel
changes in CO. An increase in CVP will
be likely due to an increased circulating
volume if the MAP also increases. An
increase in CVP will be likely due to a
decreased contractility if the MAP
decreases. In an unstable patient,
measurement of the CO may be necessary.
References
10. Magder S.
Clinical usefulness of respiratory
variations in arterial pressure. Am J
Respir Crit Care Med 2004;169:151-55
|